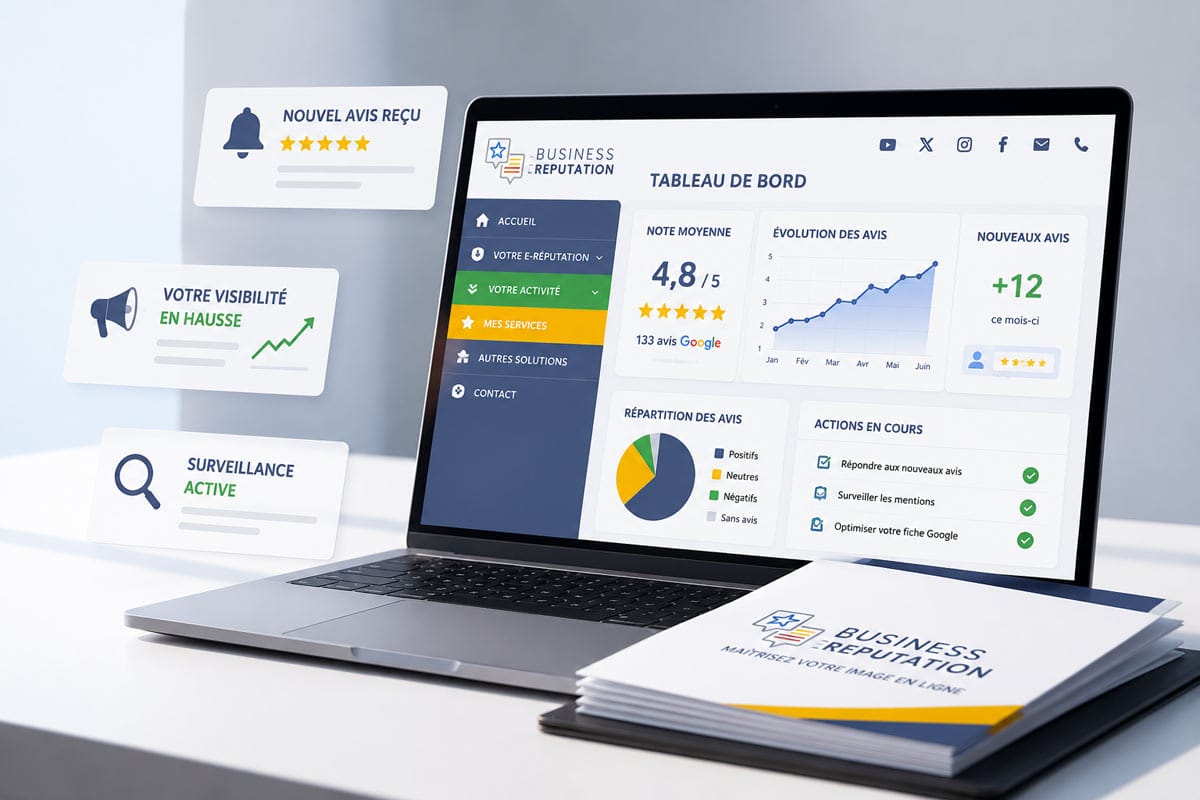
In short: piloting your online reputation without a dashboard is a bit like driving blindfolded on the freeway. The risk? Watching your competitors grab market share while generative AI recommends their names for you. Here are the five game-changing monthly indicators for any manager concerned about his visibility and Google rating.
- Average Google rating and rolling 30-day trend
- Review velocity: number of new monthly returns
- Response rate to reviews (both positive and negative)
- Overall feeling from semantic analysis
- Visibility in the Local Pack and IA citations
Why a reputation dashboard is vital in 2026
A reputation dashboard centralizes the signals that decide, every day, whether a prospect pushes open the door of your business or that of the competitor. According to BrightLocal, 87% of consumers read online reviews before choosing a local business, and a rating of less than 4 stars scares off nearly one in two customers. Without monthly monitoring, drifts go unnoticed until the day sales plunge.
Imagine Atelier Nova, a fictitious high-end joinery chain based in Bordeaux. For six months, its manager pilots the business on a whim, convinced that his quality of workmanship is good enough. Three false negative reviews submitted by a malicious competitor cause its rating to slip from 4.8 to 4.3. The result in the following quarter: -22% of incoming quote requests. The absence of regular monitoring cost more than a year’s professional support.
The massive arrival of generative engines is radically changing the game. ChatGPT, Perplexity and Gemini draw on public sources, including review aggregators, to recommend a local service provider. A brand that neglects its e-reputation simply disappears from algorithmic suggestions. Worse still, AIs don’t hesitate to point the finger at unfavorable customer feedback when the user requests a comparison.
The snowball effect on sales
A Harvard Business School study (Michael Luca, 2024) precisely quantifies the impact: every half-star gained on Yelp or Google generates between 5 and 9% additional income for an independent restaurant. For a craftsman invoicing €280,000 a year, this represents up to €25,000 in margin lost on a simple downgrade. A complete guide to this mechanism can be found in this article on the real cost of a lost star.
Monthly management is no longer a coquetry of large groups. The same algorithmic mechanisms apply to a local bakery as to an industrial SME. The difference? Brands that measure react. Brands that ignore figures cash in.
When reputation becomes a financial asset
Several accounting firms now include Google ratings and review volumes in their business valuations. A 4.9-star restaurant with 600 reviews trades for 15-20% more than an equivalent establishment with a 4.2 rating. Reputation moves from the marketing register to the balance sheet.
Average score and review velocity: the two gauges to read first
The average rating remains the first indicator visible to Internet users and AIs alike. But taken in isolation, it lies. An average of 4.6 calculated from 12 three-year-old reviews does not have the same value as a 4.4 based on 350 recent feedbacks. Review velocity tells the real story of a company’s dynamics.
For useful monthly tracking, these two gauges need to be crossed. Atelier Nova, in our example, targets a minimum of 8 to 12 new reviews per month. This rate guarantees the freshness perceived by Google’s algorithm, and signals to potential customers that business is booming. A sudden drop in velocity (less than 3 reviews in a month) often heralds a drop in business or a problem with in-store customer demand.
| Indicator | Green threshold | Orange threshold | Red threshold |
|---|---|---|---|
| Average rating | ≥ 4,6 | 4,2 à 4,5 | < 4,2 |
| Notices/month | ≥ 8 | 4 à 7 | < 4 |
| Median age of opinions | < 3 months | 3 to 6 months | > 6 months |
| 1-2 stars | < 5% | 5 à 10% | > 10% |
A dedicated review calculator helps to project the number of positive returns needed to raise a downgraded rating. The calculation is implacable: going up from 3.9 to 4.5 when you’ve accumulated 200 reviews sometimes requires 150 new five-star reviews. Better to anticipate.
Build a collection routine without pestering your customers
Collecting reviews can’t be decreed, it has to be organized. A Lyon-based restaurateur we supported in 2024 doubled his speed by placing a QR code on the bill, accompanied by a short phrase from the waiter. Zero cost, measurable impact from the second week. The method beats impersonal automated SMS campaigns that customers ignore.
The classic mistake is to solicit only after a sale has been made. However, the optimal moment varies from one sector to another. A hairdresser gets the best return rate within 24 hours. A carpenter obtains more detailed feedback two weeks after delivery, when the customer has lived with the furniture.
Response rate to reviews: the underestimated indicator that speaks to algorithms
Responding to reviews is not a courtesy option, it’s a strong signal sent to Google and generative AI. The monthly response rate should aim for 100% for negative feedback and at least 70% for positive. This simple metric distinguishes brands that take their audience seriously from those that don’t.
Google confirms in its Business Profile documentation that businesses that respond regularly gain visibility in local results. The algorithm interprets the manager’s commitment as a sign of commercial vitality. Feedback from the field shows that a listing whose response rate rises from 30% to 90% gains an average of two to three positions on competitive geolocalized queries.
On the human side, the response to a negative review sometimes transforms the detractor into an ambassador. A dissatisfied customer who receives a factual response, with a proposed solution, modifies his future behavior. They come back. They talk about it to others. An excellent Experion article on management indicators reminds us that a customer won back costs five times less than a new customer acquired.
Answer templates to avoid
Copy-and-pasted responses are detected within seconds by both readers and language models. When fifteen notices receive the same thank-you formula, the signal sent out becomes counter-productive. It’s better to send a short, personalized reply than a generic, identical one.
The tone should reflect the brand’s identity. A wine shop can afford a touch of good-natured humor. A medical practice maintains a sober register. The trap is to use a crude AI generator, without human proofreading, which produces suspicious and recognizable formulas.
Sentiment analysis and qualitative feedback: going beyond the stars
A 4.5 star rating can hide weak signals that the numbers don’t reveal. Semanticanalysis of comments detects recurring themes: quality, welcome, turnaround time, cleanliness, value for money. Tracking the monthly evolution of these themes in your dashboard identifies operational problems before they degrade your rating.
Let’s take Atelier Nova again. Over three months, the word “delay” appears in 38% of comments, compared with 12% the previous year. The overall score remains at 4.6, thanks to the quality of the work, but the signal is clear: a bottleneck is appearing in production. Without structured qualitative feedback, the manager would have discovered the problem six months later, when the score would have started to fall.
Several free solutions enable this type of analysis without a monthly software budget. A CSV export of reviews into Google Sheets, coupled with a keyword-based counting formula, is all that’s needed for a local SME. The complete methodology is detailed in this self-sufficient guide to Google management.
Detect false reviews in the monthly feed
Semantic analysis also helps to spot suspicious returns. A five-star review with no comments, submitted by an account created on the same day, has all the hallmarks of a false positive. Conversely, a one-star review mentioning a service you don’t offer betrays a competitive attack. Structured reputation monitoring makes these checks part of your monthly routine.
In 2026, automated review attacks are on the increase. Several French retailers have reported coordinated waves of negative reviews posted in less than 48 hours, often preceded by an extortion attempt by e-mail. Early detection requires daily monitoring and immediate reporting to Google with supporting evidence.
Visibility in the Local Pack and presence in IA recommendations
The fifth indicator, still largely ignored, measures actual visibility performance. Appearing in the top 3 of Google’s Local Pack generates up to 70% of clicks on local queries. Leaving this trio means becoming invisible, whatever the quality of the product. Monthly monitoring of positioning on 10 to 15 strategic queries is becoming a must.
New for 2026 is monthly monitoring of quotations in AI engine responses. Monthly testing of queries such as “best carpenter in Bordeaux” or “where to buy organic bread in Toulouse” in ChatGPT, Perplexity and Gemini reveals whether your brand is cited, ignored or negatively described. This practice, dubbed GEO (Generative Engine Optimization), completely redefines reputation management.
| Source of visibility | Inspection frequency | Monthly target |
|---|---|---|
| Local Pack Google | Weekly | Top 3 on 80% of queries |
| Google Maps positioning | Monthly | Top 5 extended zone |
| ChatGPT/Perplexity Quotes | Monthly | Mention on 5 test queries |
| Apple Maps / Bing Places | Quarterly | Consistency of information |
Brands that dominate reputational SEO in 2026 are building a virtuous circle: higher ratings, more reviews, better visibility, more customers, more reviews. Those that remain passive see their position deteriorate quarter after quarter, nibbled away by more organized competitors. Owltech’s article on dashboards provides an excellent deciphering of these mechanisms.
Anticipate rather than suffer: predictive reputation
Monthly monitoring reaches its full potential when it becomes predictive. By combining the velocity of opinions, sentiment and internal weak signals (turnover, after-sales complaint feedback), we can anticipate a reputational crisis several weeks before it erupts publicly. This approach is explored in this dossier on predictive reputation.
In concrete terms, a restaurant owner who simultaneously observes an increase in the word “wait” in comments, a rise in room turnover and a drop in the rating from 4.7 to 4.5 over two months has all the data needed to react. Without a dashboard, these three signals remain scattered, invisible, until the tipping point.
The cost of a reputable dashboard is a well-constructed Excel sheet and an hour’s monthly review. The cost of not having one can be counted in thousands of euros in lost sales, in lost customers, in market share ceded to competitors who have understood that monthly monitoring is no longer an option, but the vital minimum for any manager who wants to make an impact in the digital landscape of 2026.